At the system-wide level, we have utilized data on youth poverty, early childhood risk factors and School District of Philadelphia data including school dropout rates and school progress scores, and overlaid our OST data in the form of maps and other easy to understand visual formats. This has been valuable for all levels of stakeholders especially in terms of better potential program planning and subsequent coordination within OST networks to address gaps.
Early Literacy
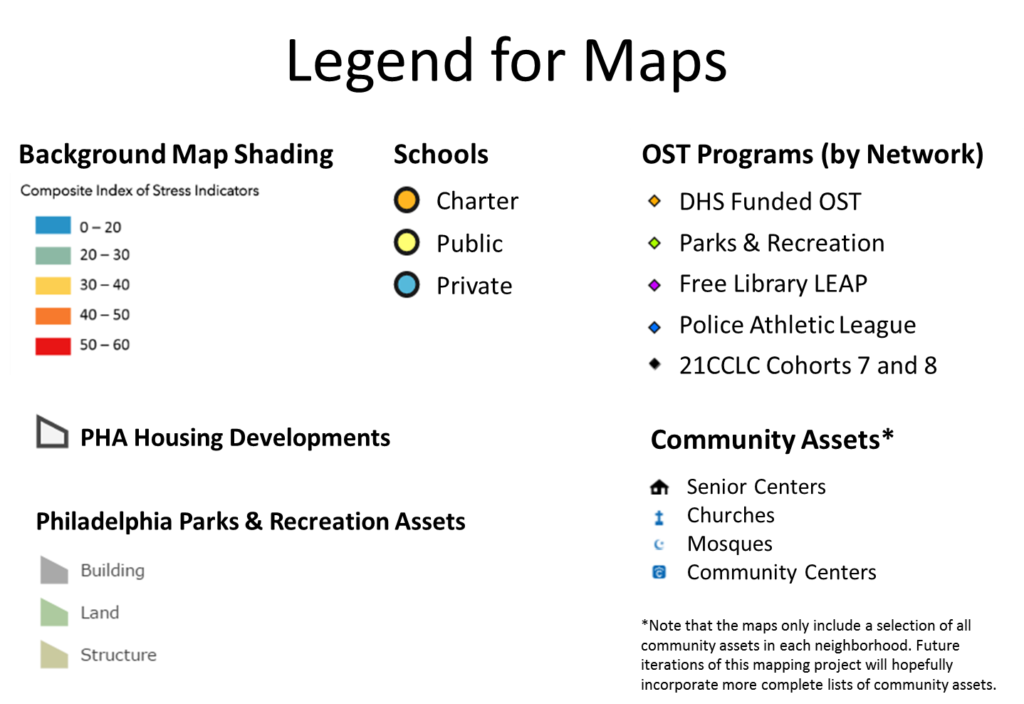
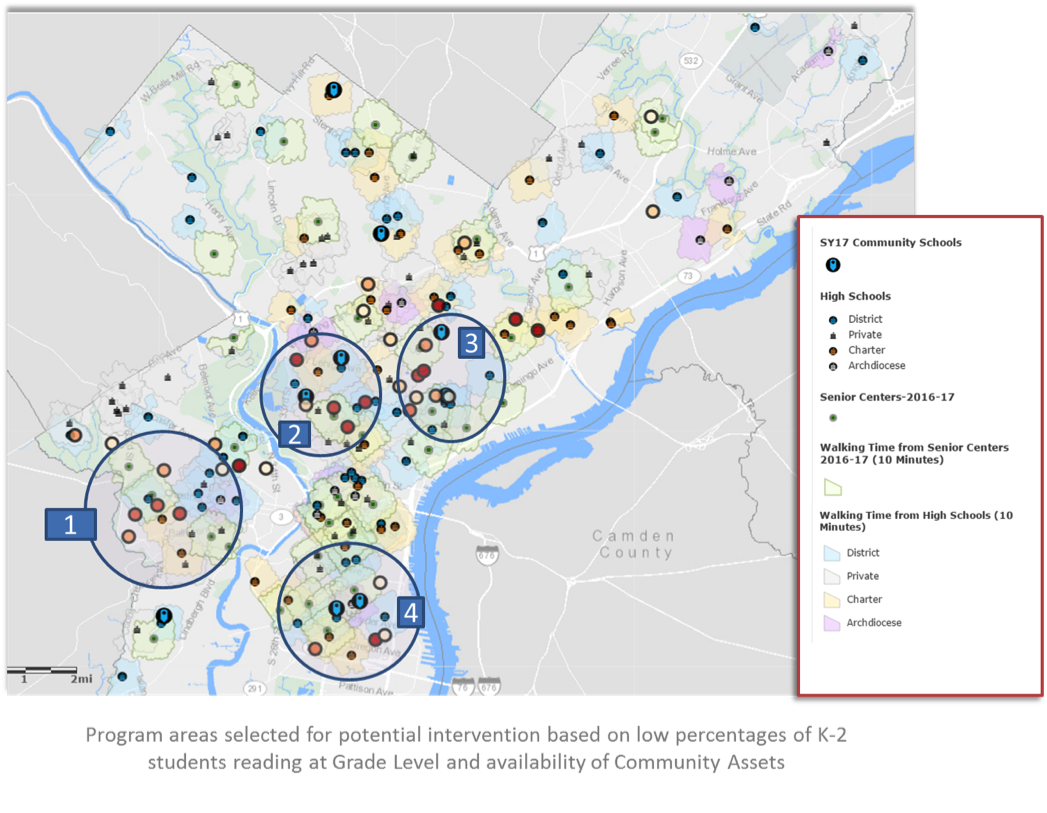
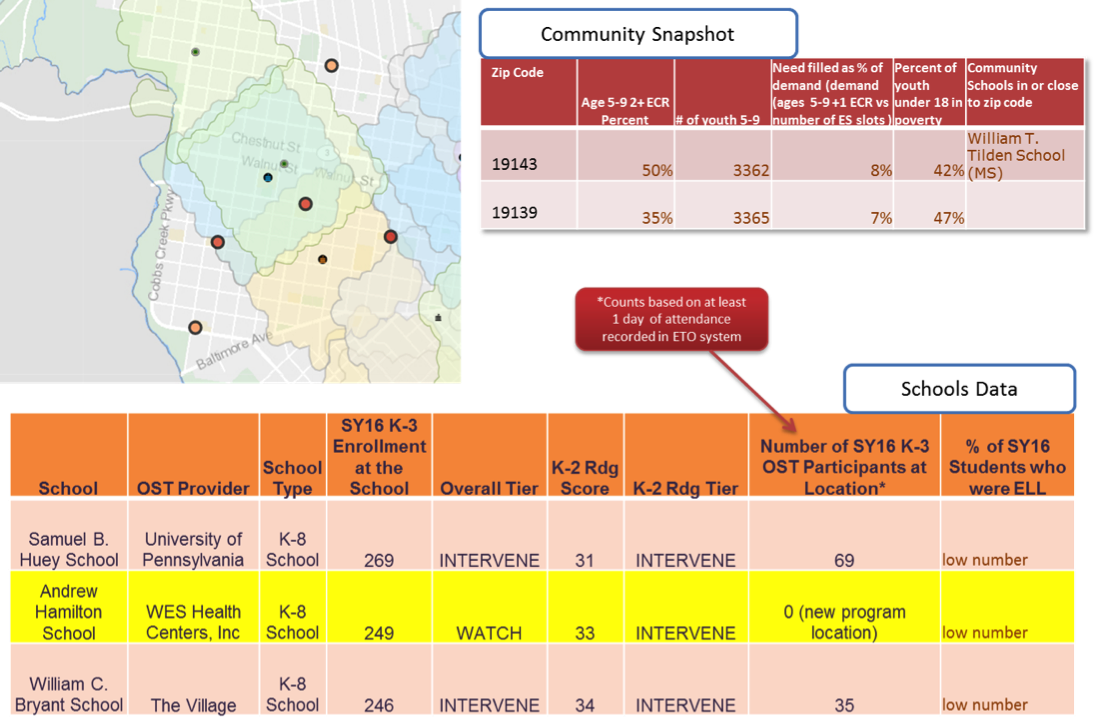
One of the Initiative’s key outcomes is to increase the number of children reading at grade level. As a first step to better understand the role of OST in this space we began by mapping community data and School of District of Philadelphia (SDP) data. The Community Snapshot sorted by zip code included the number of students ages 5-9 who had two or more early childhood risk indicators, and we compared this against the number of known OST slots available in each zip code. In addition, SDP elementary schools were mapped based on their K-2 Reading Scores and the number of OST slots at each school.
Understanding OST Deserts
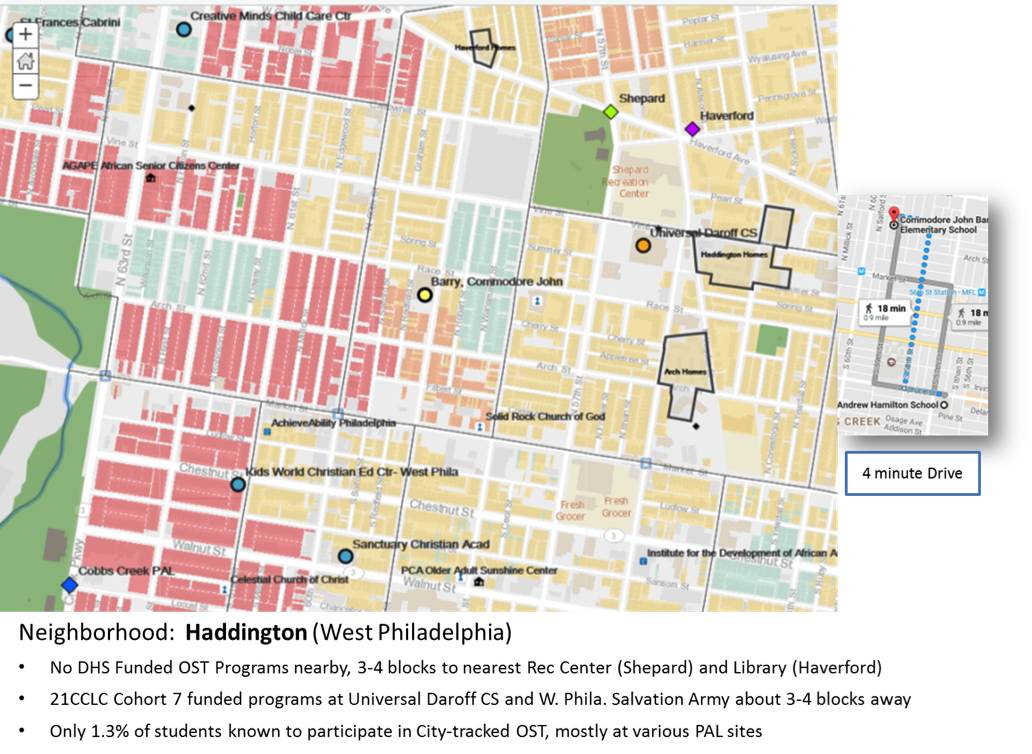
Another of the plan’s objectives is to develop focused and intensive OST work in local areas of greatest need. This led us to ask— How will we define need and a local area? An initial step we have taken includes mapping SDP progress report data, the Community Schools Initiative block-group level stress index, and the availability of OST programming in surrounding neighborhoods.

Barry K-8 School Neighborhood Profile